R Graphics · Venn Diagram

Explaining Set Relationships with Venn Diagrams in R

Construct two- and three-set diagrams, label intersections, show counts, use transparency, and build diagrams from real sets.

6 examplesReproducible R code
Before you begin

Choose the variation that serves the analysis

Venn diagrams communicate overlap among a small number of sets. They are effective for conceptual relationships and simple counts, but complex set systems are better handled by an UpSet plot or table.

Examples
06
Levels
Beginner + Intermediate
01
Example 01Base RBeginner

Draw a Two-Set Venn Diagram

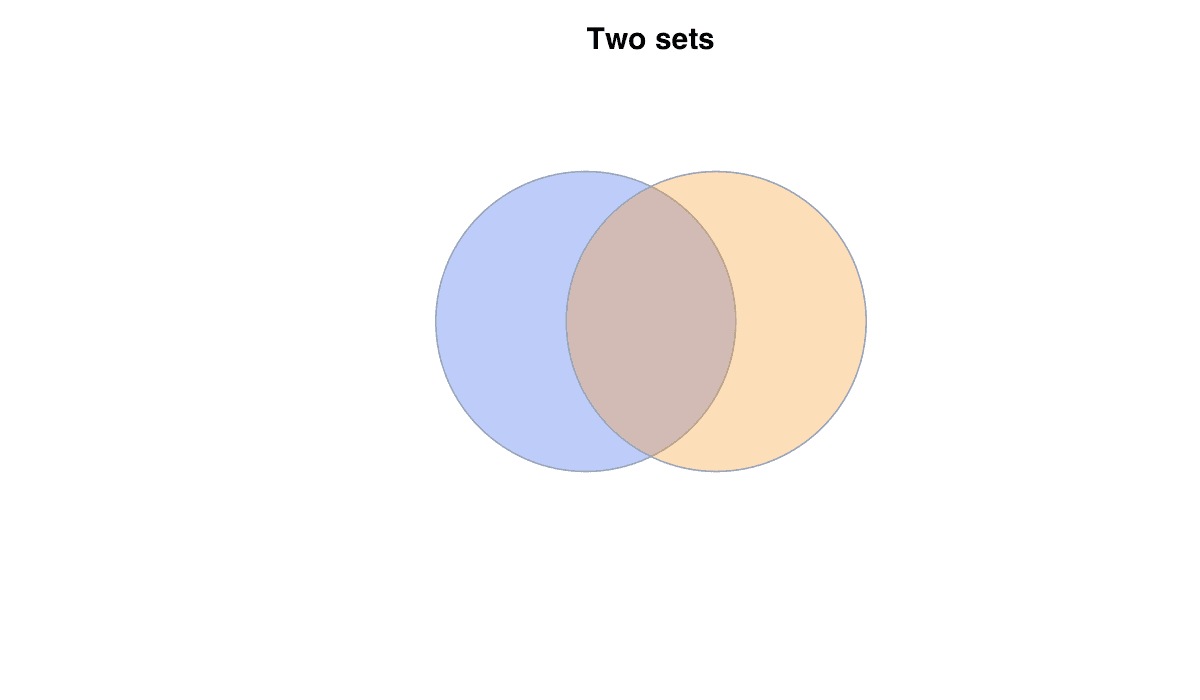
Two overlapping circles divide observations into A only, B only, and their intersection.
Draw a Two-Set Venn Diagram example generated in R
R-generated example output.

Transparent fills keep the overlap visible. Place set labels outside the circles and intersection information centrally.

RRun this code
plot.new(); plot.window(xlim = c(0,10), ylim = c(0,7), asp = 1)
symbols(c(4,6), c(3.5,3.5), circles = c(2.4,2.4), inches = FALSE, add = TRUE,
        bg = c(adjustcolor("#2563eb",.4), adjustcolor("#f59e0b",.4)))
text(c(2.5,7.5,5), c(6,6,3.5), c("Set A","Set B","A ∩ B"), font = 2)
02
Example 02Base RBeginner

Display Region Counts

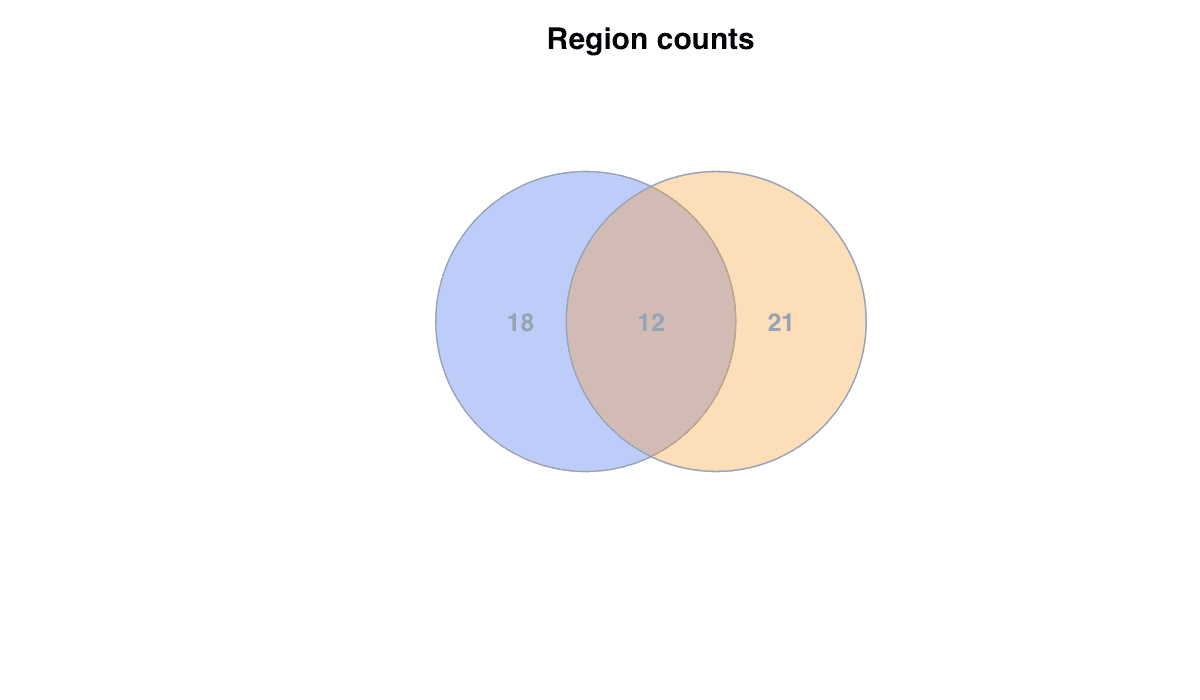
Counts quantify the exclusive and shared portions of the sets.
Display Region Counts example generated in R
R-generated example output.

Place each count inside its corresponding region and state the universe or sample from which sets were formed.

RRun this code
plot.new(); plot.window(xlim=c(0,10), ylim=c(0,7), asp=1)
symbols(c(4,6), c(3.5,3.5), circles=c(2.4,2.4), inches=FALSE, add=TRUE,
        bg=c(adjustcolor("#2563eb",.4),adjustcolor("#f59e0b",.4)))
text(c(3,5,7), 3.5, c(18,12,21), cex=1.4, font=2)
03
Example 03Base RBeginner

Extend the Diagram to Three Sets

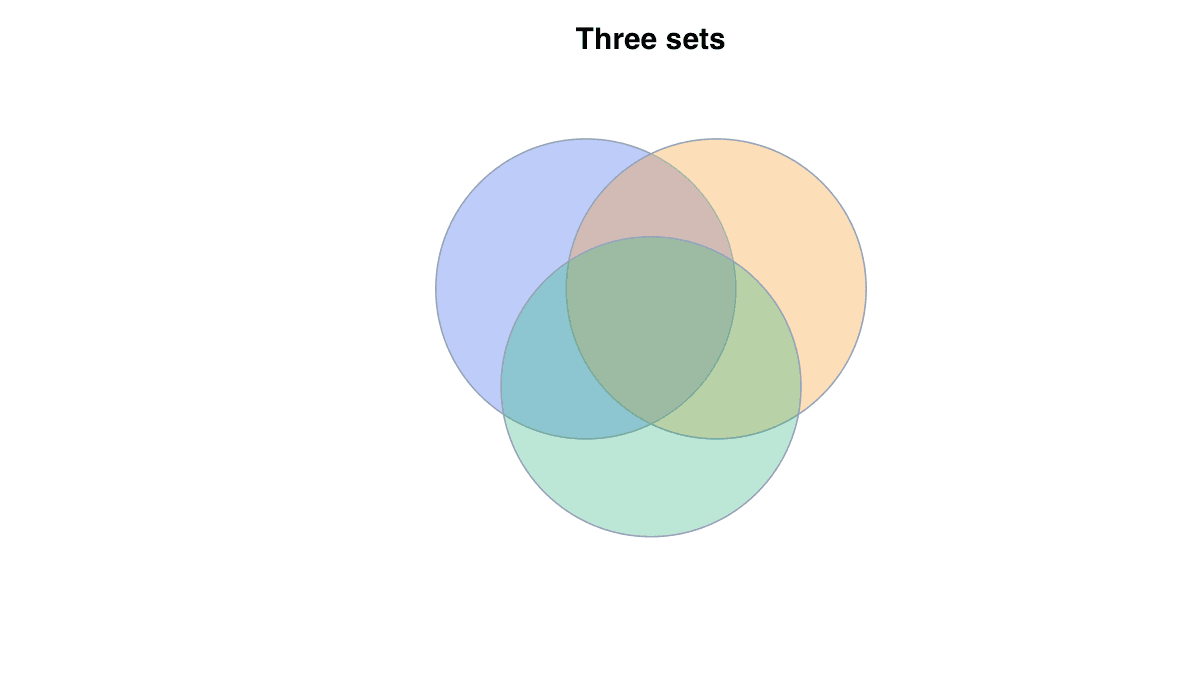
Three circles create regions for exclusive, pairwise, and three-way intersections.
Extend the Diagram to Three Sets example generated in R
R-generated example output.

Keep labels and counts sparse. With more than three or four sets, the number of intersections becomes difficult to read.

RRun this code
plot.new(); plot.window(xlim=c(0,10), ylim=c(0,8), asp=1)
cols <- adjustcolor(c("#2563eb","#f59e0b","#10b981"),.35)
symbols(c(4,6,5), c(4.5,4.5,2.8), circles=rep(2.4,3), inches=FALSE, add=TRUE, bg=cols)
text(c(2.6,7.4,5), c(6.8,6.8,.3), c("A","B","C"), font=2)
04
Example 04Base RIntermediate

Build Sets from Data

Real sets can be created from logical conditions or category membership.
Build Sets from Data example generated in R
R-generated example output.

Use intersect(), setdiff(), and union() to calculate the values printed in each diagram region.

RRun this code
A <- rownames(mtcars)[mtcars$mpg > 20]
B <- rownames(mtcars)[mtcars$hp > 110]
c(A_only = length(setdiff(A,B)),
  both = length(intersect(A,B)),
  B_only = length(setdiff(B,A)))
05
Example 05Base RIntermediate

Approximate Relative Set Sizes

Circle sizes can roughly reflect the relative sizes of sets.
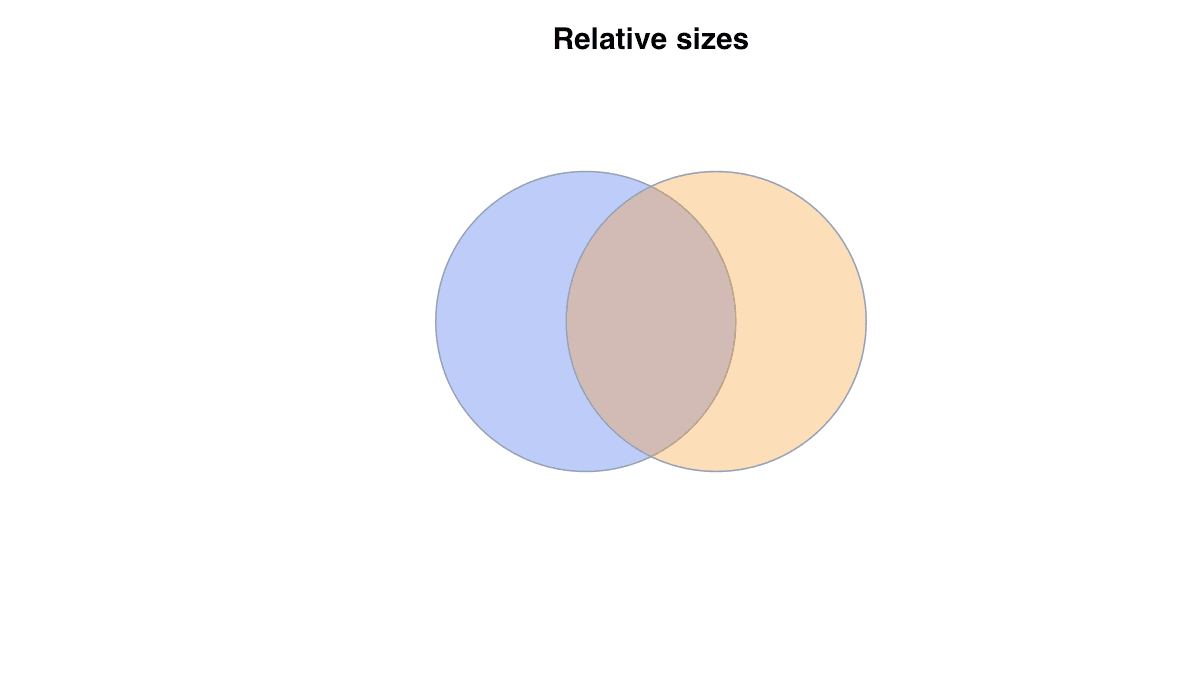
Approximate Relative Set Sizes example generated in R
R-generated example output.

Area-proportional diagrams are difficult to construct exactly; treat manually scaled circles as an approximation and report counts.

RRun this code
nA <- 35; nB <- 60
plot.new(); plot.window(xlim=c(0,12), ylim=c(0,8), asp=1)
symbols(c(4,7), c(4,4), circles=sqrt(c(nA,nB)/pi), inches=FALSE, add=TRUE,
        bg=adjustcolor(c("#2563eb","#f59e0b"),.35))
text(c(3,8), 4, c(nA,nB), font=2)
06
Example 06Base RIntermediate

Know When to Use an Alternative

An UpSet-style count plot is clearer when many intersections must be compared.
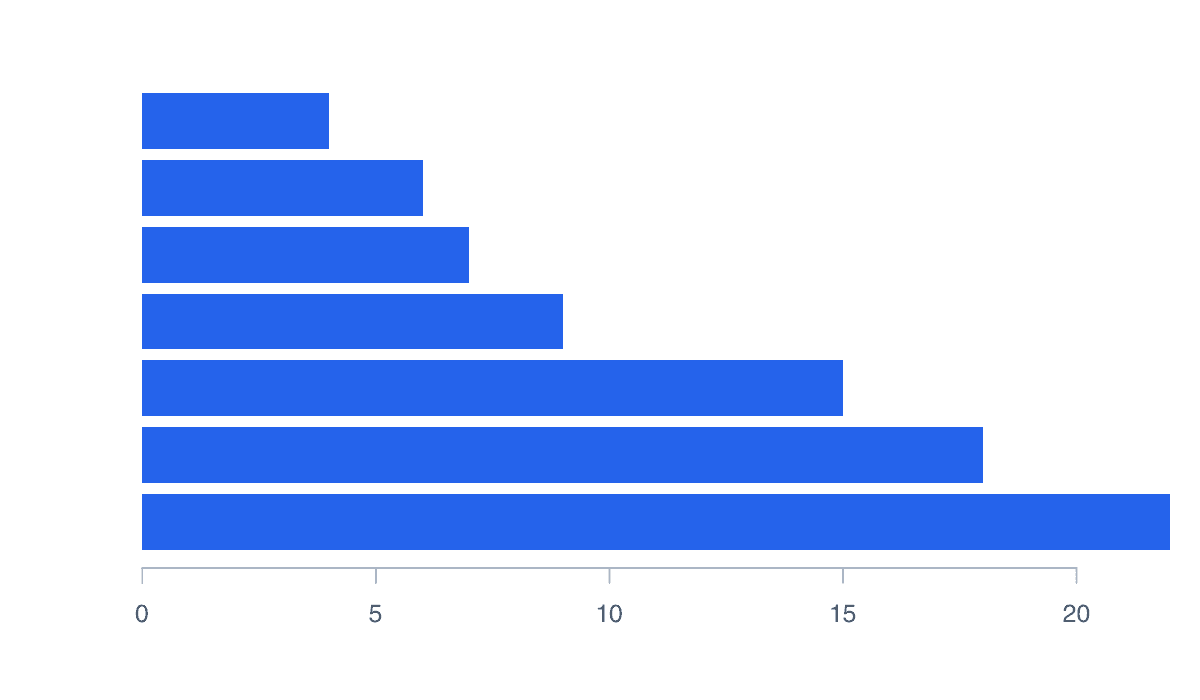
Know When to Use an Alternative example generated in R
R-generated example output.

Use bars or an intersection matrix for four or more sets, where overlapping circles become visually ambiguous.

RRun this code
intersection_counts <- c("A only"=22,"B only"=18,"C only"=15,
                         "A & B"=9,"A & C"=7,"B & C"=6,"A & B & C"=4)
barplot(sort(intersection_counts), horiz=TRUE, las=1,
        col="#2563eb", border=NA, xlab="Elements")